When developing an application, there are a variety of tests that need to be carried out, ranging from unit testing to performance testing.
These tests are vital for checking the readiness of the application. Today, we are going to discuss one of these test types: performance testing.
Performance testing is a technique of software testing in which we examine the speed, response time, stability, dependability, scalability, and resource utilization of a software to determine whether or not it will be able to easily handle the users once it has been released to the public. Testing for performance is done primarily with the goal of locating and fixing any performance bottlenecks that may exist within a software application.
The majority of performance testing is carried out with the assistance of automated technologies such as JMeter, which are exceptionally effective in this capacity. To put it simply, they help you perform load testing, functional behavior analysis, and performance evaluation on your software. Because it generates a large number of concurrent users and acts as a load simulator, JMeter testing makes it feasible for the company to test many aspects of its operations. JMeter was originally designed to test software applications, but it has now been extended to perform other kinds of testing as well.
Extending JMeter for Better Visualization
JMeter already has a tonne of functions, and since it’s open source, there are a tonne of different plugins that can quickly expand those functionalities and add features.
There are several plugins available that can be used to improve JMeter’s capabilities. For users, JMeter Plugins offer a more user-friendly means of installing and maintaining JMeter’s functionality. Let’s talk about a few of them.
Flexible File Writer

JMeter already includes a basic file writer that works with established file formats. With the use of the Flexible File Writer listener element, you can expand the functionality of JMeter. This element can be helpful for gathering specific data about each sample or saving the values of JMeter variables to a file because it is made for customized logging.
In contrast to the simple file writer, which only supports the creation of files in the XML or CSV formats, this plugin offers a number of features that may be utilized by the user to write test results in a flexible format. Through the JMeter GUI, changing the format of the log file is simple. This plugin is a favorite among users due to the variety of capabilities connected to it. Keep in mind that this plugin can also be installed as a component of the “jpgc – Standard Set” plugin.
Response Over Time

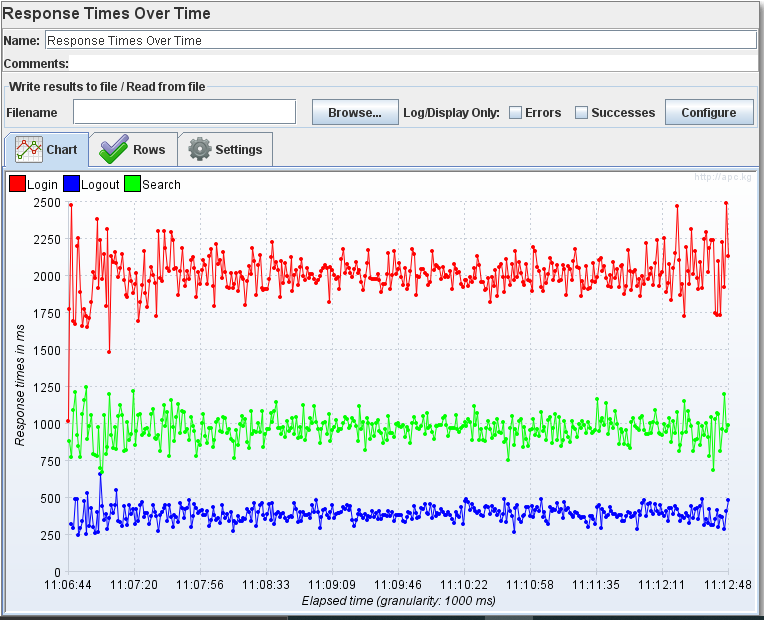
Jmeter comes with most fundamental graph formats already built in. However, when you’re testing an application, those graphs might not be adequate. In such a case, you have the option of using the “response over time” plugin, formally known as 3 basic graphs, which displays some extra graphs.
There are a number of other graphs that can be displayed, such as the response time over time graph, the active threads over time graph, and the transactions per second graph. These graphs illustrate, for the most part, how long it takes for a request to be completed, as well as the number of threads that are now active and sending data about users. In other words, they demonstrate the number of people that are connected to the website at the same time. It essentially adds three active listeners that are utilized in the process of creating these graphs. This results in an increase in Jmeter’s capacity.
Inter-thread Communication

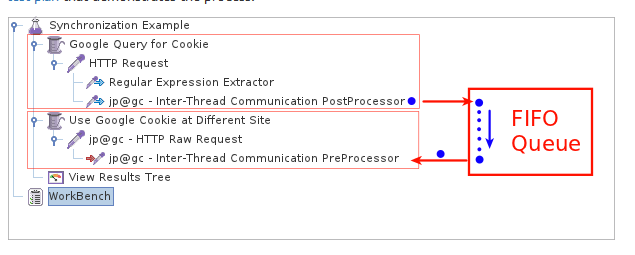
Inter-thread communication is typically not supported by JMeter because the tool lacks the necessary features. The inter-thread plugin’s primary responsibility is to handle data transfers across various thread groups, which may directly indicate the users who are concurrently active. This value is added to one thread group, and then another thread group is able to obtain that value. Both the pre-processor and the post-processor are compatible with the plugin. It utilizes several methods such as fifoPut, fifoGet, fifoPop, and fifoSize in addition to pre and post “inter thread” processors so that users can put separate thread groups in sync with one another.
These various methods perform like a charm. For example, fifoPut adds the item to a queue, and fifoGet reads the item but does not remove it from the queue. Both of these functions work well. If there is no item in the queue, the function does not wait but instead produces an empty string. The removal is carried out, for the most part, by fifoPop, which reads the item and then removes that item from the queue. In the event that there is no data in the queue yet, it will wait for it to fill up before beginning its work.
It essentially raises the limit of the inter-thread capabilities and enhances Jmeter’s usefulness.
Conclusion
JMeter is an open source tool that comes with great capabilities for performance testing. It is equipped with a number of useful features that can help to improve efficiency during performance testing.
As it is open source, there is a wide variety of plugins that can be downloaded and installed. These plugins can be used to increase the capabilities of the software, which in turn can make it significantly more useful. We have gone through a couple of plugins that, when used in conjunction with Jmeter, may make a large number of features available on it. This not only helps save time but also improves its overall performance.